HMS-dashboard
🚑 Hospital Emergency Room Dashboard
📌 Project Overview
The Hospital Emergency Room Dashboard is an advanced Power BI solution designed to analyze emergency room (ER) operations, patient demographics, referral patterns, and performance metrics. This interactive dashboard provides data-driven insights to enhance decision-making, improve patient care, and optimize resource allocation.
🏥 Data Fields
🔹 Patient Information:
- 🆔 Patient ID: Unique identifier for each patient.
- 📅 Admission Date: Date & time of ER admission.
- 🔤 First Initial: First letter of patient’s first name (for anonymization).
- 👤 Last Name: Anonymized last name.
- ⚧ Gender: Male, Female, or Other/Nonbinary.
- 🎂 Age: Patient’s age at admission.
- 🌍 Race: Self-reported racial/ethnic identity.
🔹 Medical & Operational Data:
- 🏥 Department Referral: ER referrals (Cardiology, Orthopaedics, etc.).
- ✅ Admission Flag:
True(Admitted) /False(Discharged). - ⭐ Satisfaction Score: 1-10 rating based on patient experience.
- ⏳ Wait Time: Time elapsed from arrival to first medical attention.
- 🩺 Case Manager (CM): Assigned case manager for patient coordination.
📊 Project Workflow
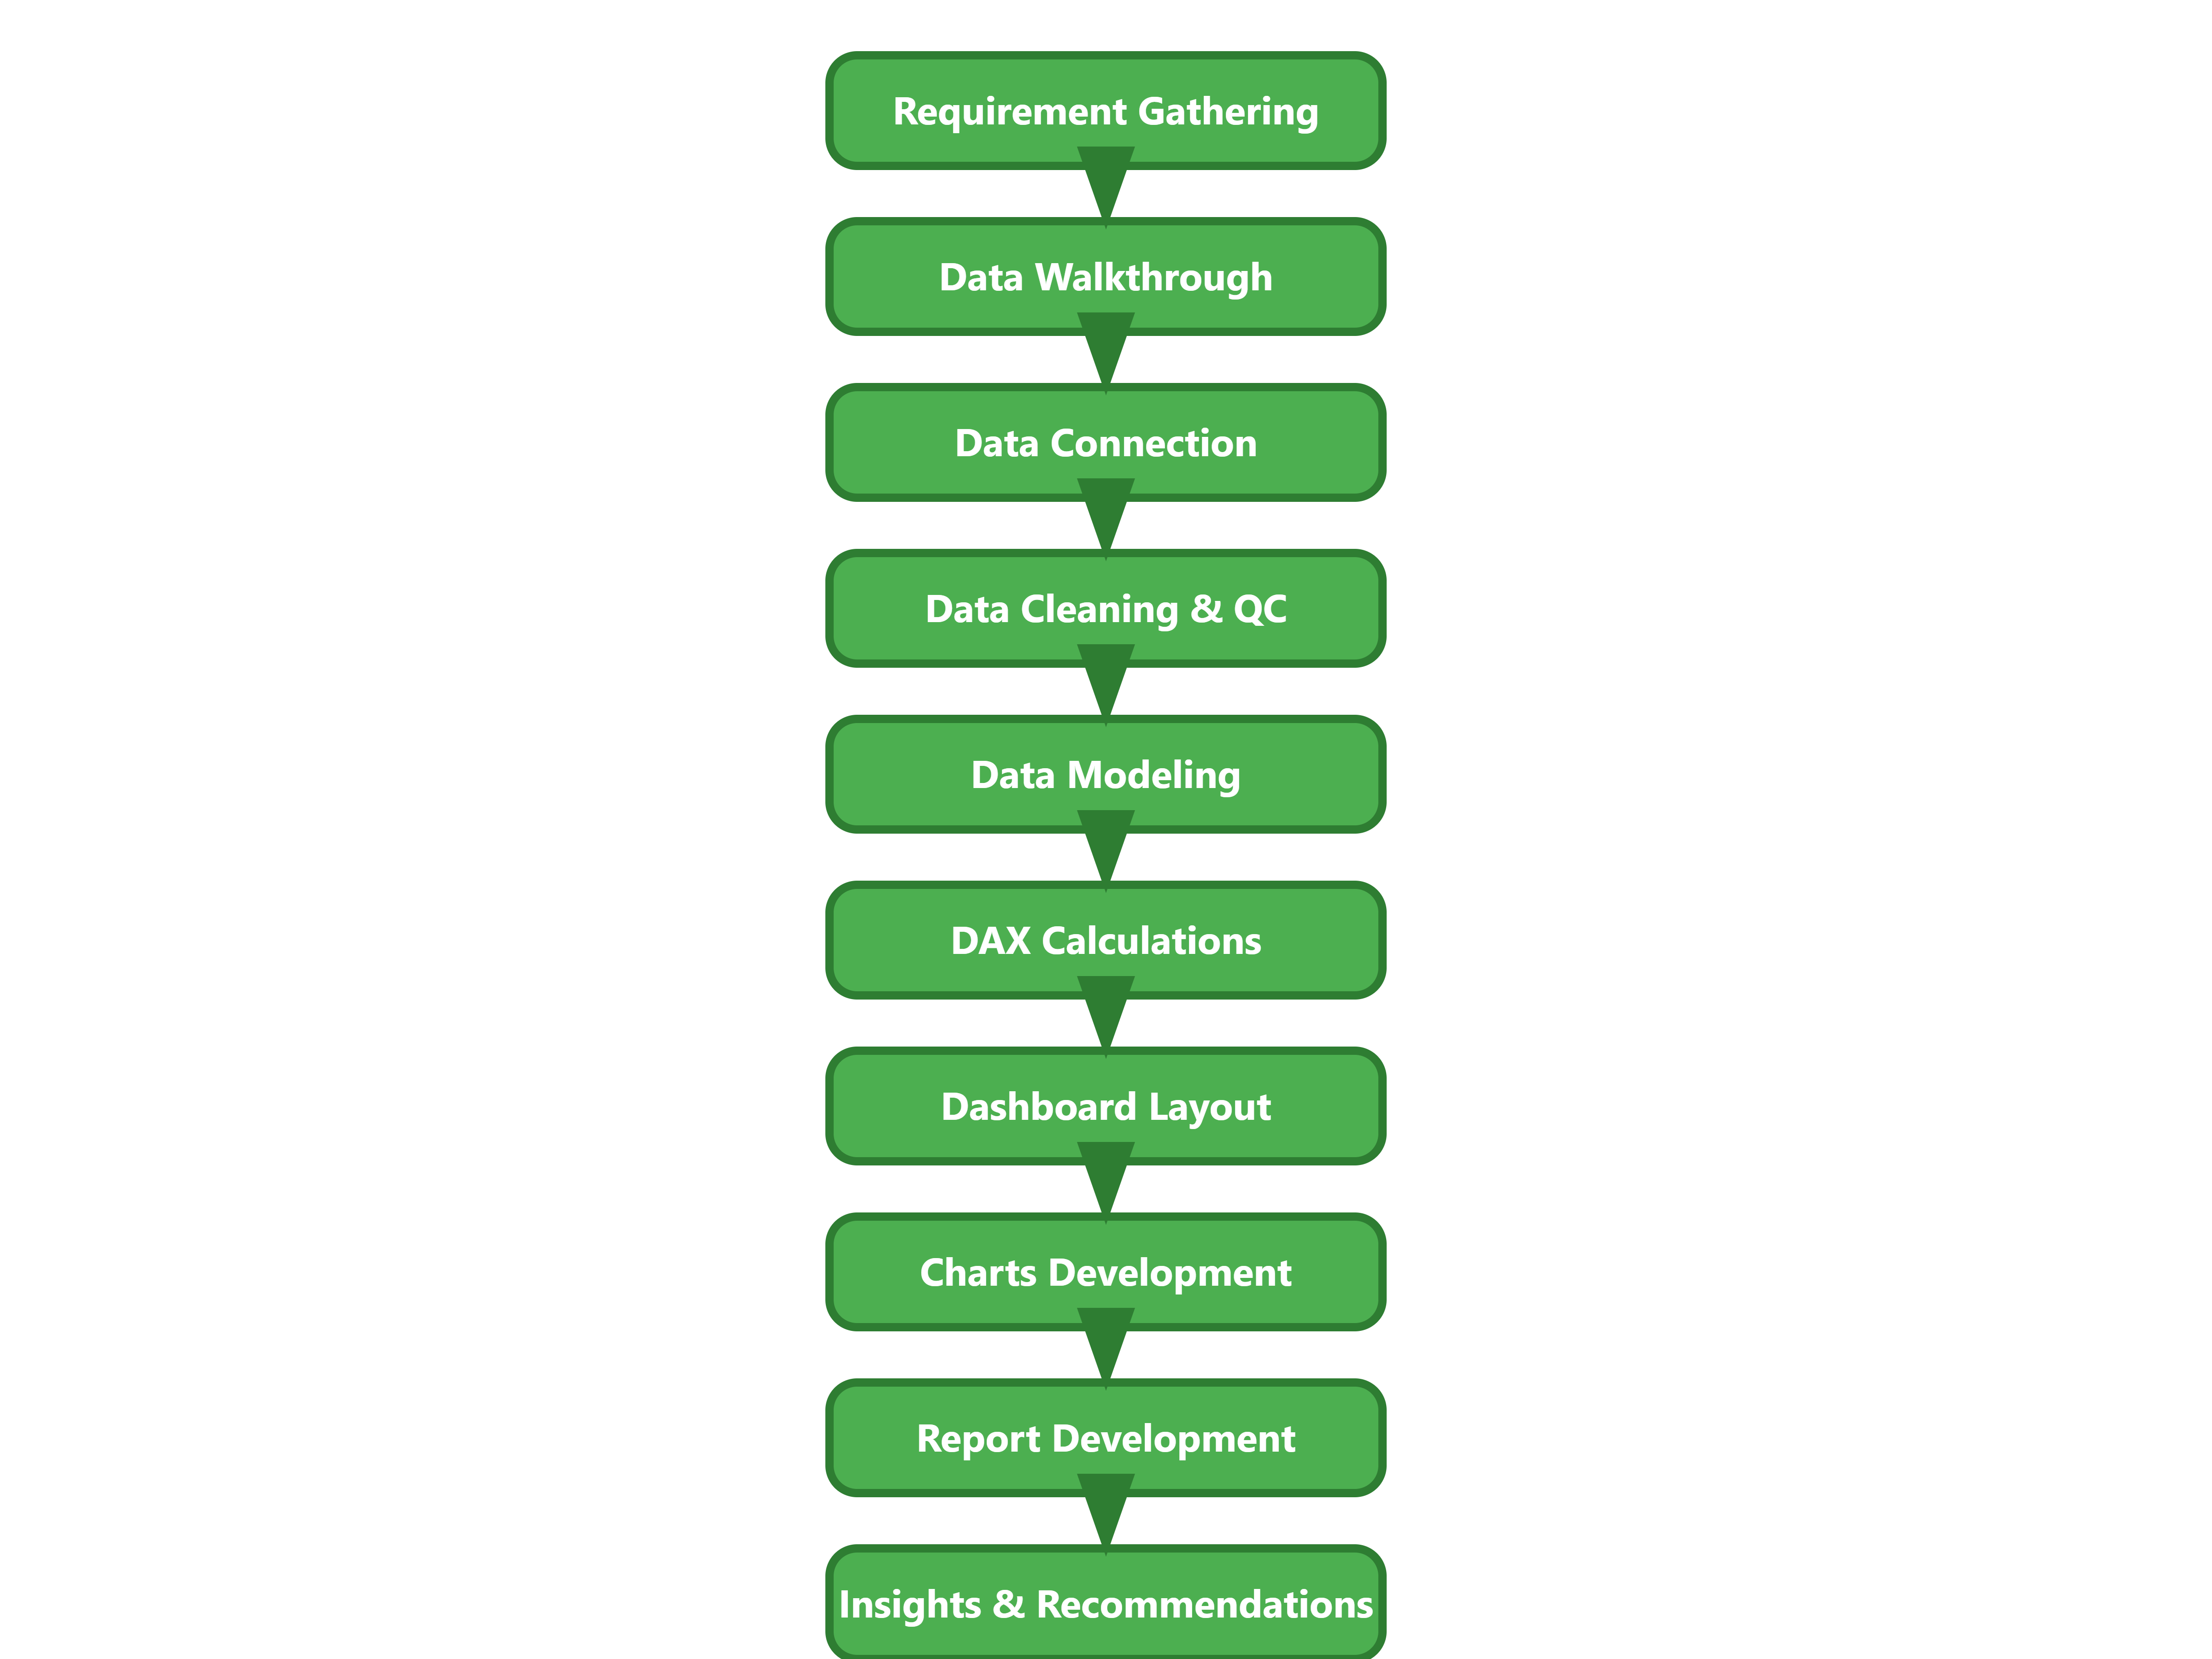
📌 Dashboard Views
This Power BI report consists of three interactive dashboards:
- 📆 Monthly View: Tracks patient admissions, referrals, and wait times by month.
- 📊 Consolidated View: Provides an overview of ER efficiency, patient demographics, and department load.
- 🔎 Patient Details: Focuses on individual patient records and treatment information.
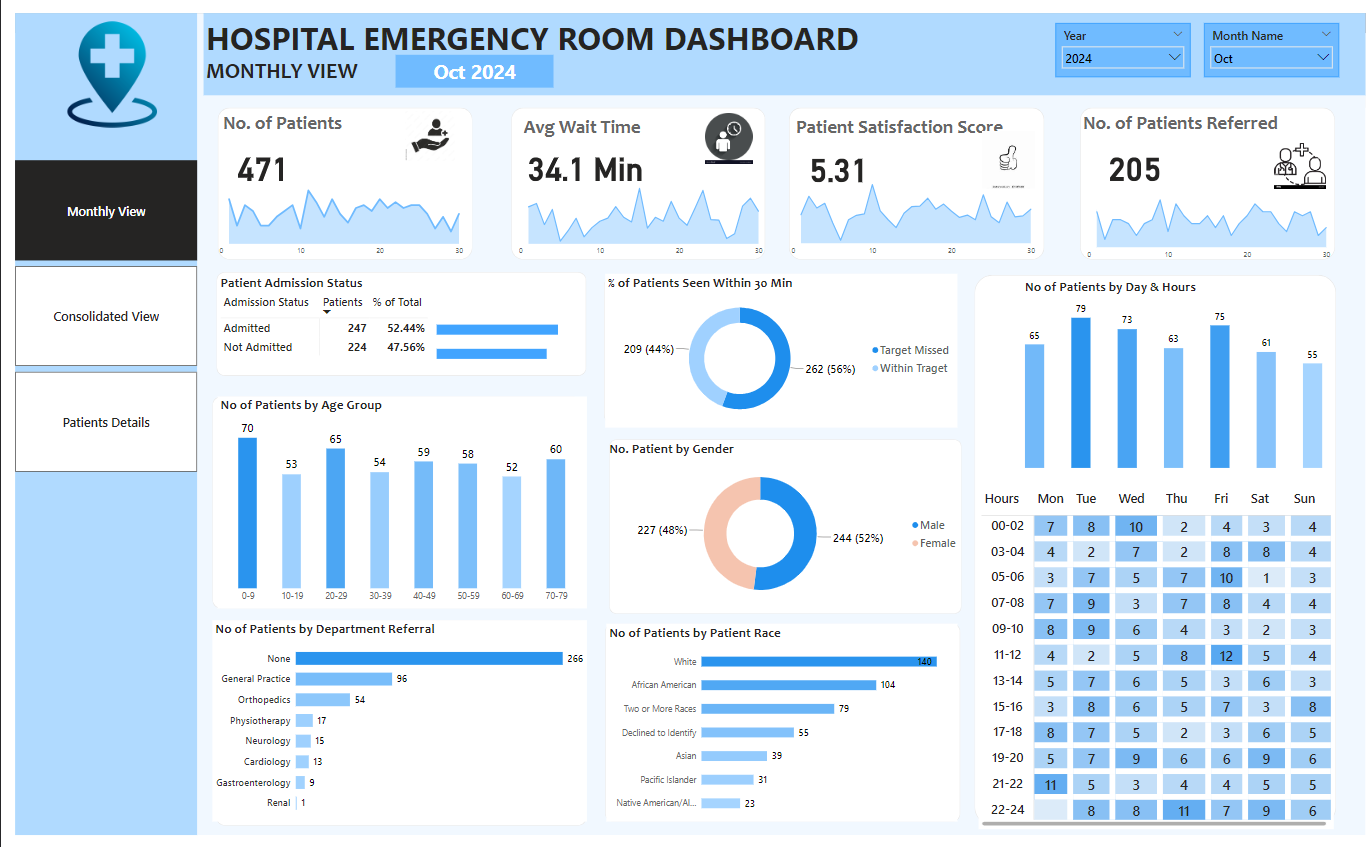
📈 Descriptive Analysis (April 2023 - October 2024)
This dataset covers 9,216 unique patients over 19 months, revealing crucial insights into ER operations.
🔹 Key Findings:
- ⏳ Patient Wait Time & Satisfaction:
- Average wait time: ~35.3 minutes 🚦 (Improvement needed).
- Average satisfaction score: 4.99/10 ⭐ (Moderate satisfaction).
- 🏥 Departmental Referrals:
- 5,400 patients did not require referrals.
- Common referrals: General Practice (1,840 cases), Orthopaedics (995 cases), Physiotherapy (276 cases), and Cardiology (248 cases).
- 📅 Peak Busy Periods:
- Busiest days: Monday (1,377), Saturday (1,322), and Tuesday (1,318).
- Busiest hours: ⏰ 11 AM, 1 PM, 7 PM, and 11 PM.
- 👥 Patient Demographics:
- Age Groups:
- Adults (30-39 years): 1,200 patients.
- Young adults (20-29 years): 1,188 patients.
- Race Distribution:
- White: 2,571 patients.
- African American: 1,951 patients.
- Multiracial: 1,557 patients.
- Asian: 1,060 patients.
- Declined to identify: 1,030 patients.
- Age Groups:
- 🏨 Admission Patterns:
- 4,612 patients (50%) were admitted for further treatment.
- 4,604 patients were treated and released.
📌 Conclusion & Recommendations
✅ Reduce Wait Time: Optimize patient flow & staffing to improve efficiency.
✅ Improve Satisfaction: Address areas with low patient satisfaction (4.99/10).
✅ Strategic Staffing: Peak hours (11 AM, 1 PM, 7 PM, 11 PM) require better workforce allocation.
✅ Optimize Departmental Capacity: General Practice & Orthopaedics referrals indicate a need for increased resources.
✅ Diversity & Inclusion: Data-driven insights support equitable healthcare services.
🚀 This Power BI dashboard provides actionable insights for hospital administrators, ER managers, and healthcare policymakers to improve emergency room operations and patient care!